
Data Science and Database Administrative/Architectural Services
Data scientists rely upon expertise in disciplines within the fields of science, mathematics, statistics and computer science, and they utilize information technology to investigate complex real world phenomena. These disciplines represent great breadth and diversity of knowledge, and the data scientist is an expert in each of these fields.
The database is a functional component of competitive intelligence, which encompasses relational database data mining, and data analysis techniques including signal processing, probability models, machine learning, statistical learning, computer programming, data engineering, pattern recognition and learning, visualization, predictive analytics, uncertainty modeling, data warehousing, and high performance computing.

|
|
|
|
|
|
|
|
| Excel | Access | SQL | MySQL | Oracle | Perl | PHP |
- Design
- Construct
- Data definition – define data types and the relationships among them
- Populate
- Data manipulation – inserting, updating, or deleting data occurrences
- Data Query
- Forms
- Reports
- Maintenance
- Repair
- Referrential Integrity Validation
- Forensic Database Conversion
- Statistical Data Analysis
- Data Visualization
- Data Mining
Example Database Management System (DBMS)


* This technology later evolved into the cloud.
Graphic User Interface

Bioinformatics and Bioengineering

Data Science
Data science qualitative statistical procedures and data visualization analyses are integral to nonfinancial fields, ranging from the biological sciences to the humanities. In contrast, Data Science quantitative statistical procedures and data visualization analyses are integral to numismatic fields such as economics, business and finance.
The evolution of data science resulted in the emergence of the field of clinical trials. The clinical data scientist evolved from the role of a statistical consultant into a more strategic role with responsibilities that include determining the planning, collection, transformation, analysis and reporting of clinical trial data. Clinical data science is integral to answering medical questions involving metabolism, pathology and absorption, and to documenting the safety and efficacy of novel and existing therapeutic compounds through the the statistical analyses of large complex biological data sets using machine learning, optimization, signal processing, text retrieval and natural language processing techniques.


|

|

|

|
| Debian | Minitab | SPSS | SAS |
| |||
Example Data Science Implementation - Protein Crystallography


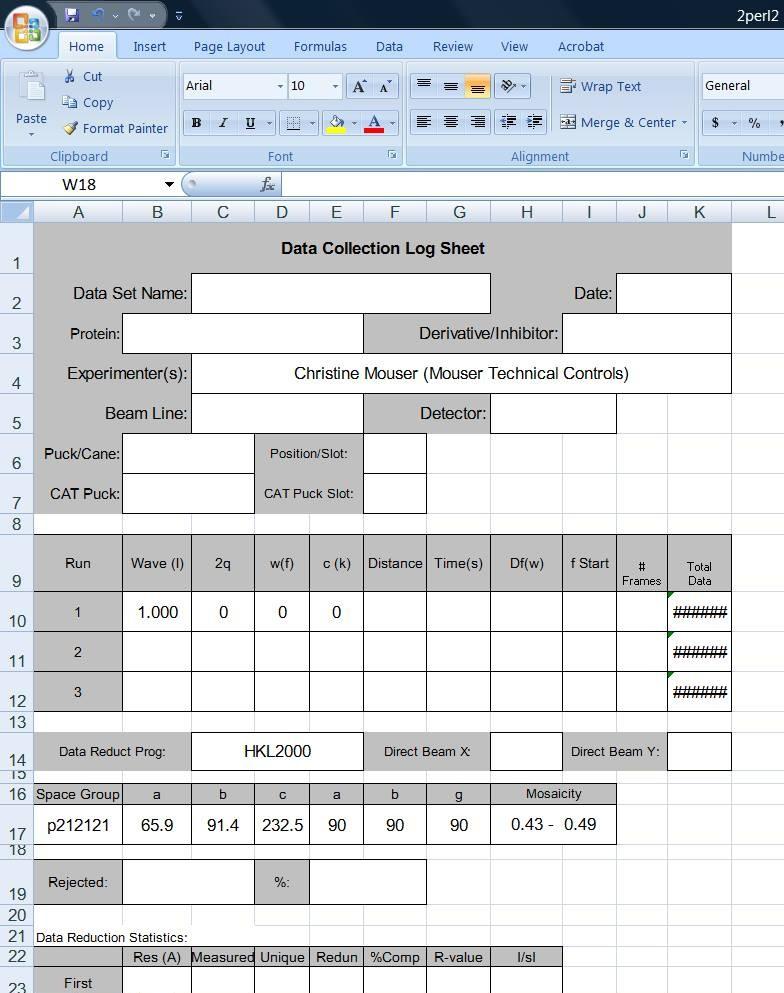
These spreadsheets are then automatically saved in a database along with the raw data files. Streamlining the reporting processes through the automation of redundant tasks allows you to better leverage time, people and other valuable resources. This results in lowering the bottom line when it comes to the cost of doing business, which contributes to furhtering the growth of your business.

Charles Joseph Minard
(March 27, 1781 – October 24. 1870) was a French civil engineer recognized for his significant contribution in the field of information graphics in civil engineering and statistics.
Minard was a pioneer in the use of graphics in engineering and statistics. He is most well known for his cartographic depiction of numerical data on a map of Napoleon's disastrous losses suffered during the Russian campaign of 1812. The illustration depicts Napoleon's army departing the Polish-Russian border. Modern information scientists say the illustration may be the best statistical graphic ever drawn.
A thick band illustrates the size of his army at specific geographic points during their advance and retreat. It displays six types of data in two dimensions: 1) the number of Napoleon's troops; 2) the distance traveled; 3) temperature; 4) latitude and longitude; 5) direction of travel; and 6) location relative to specific dates:
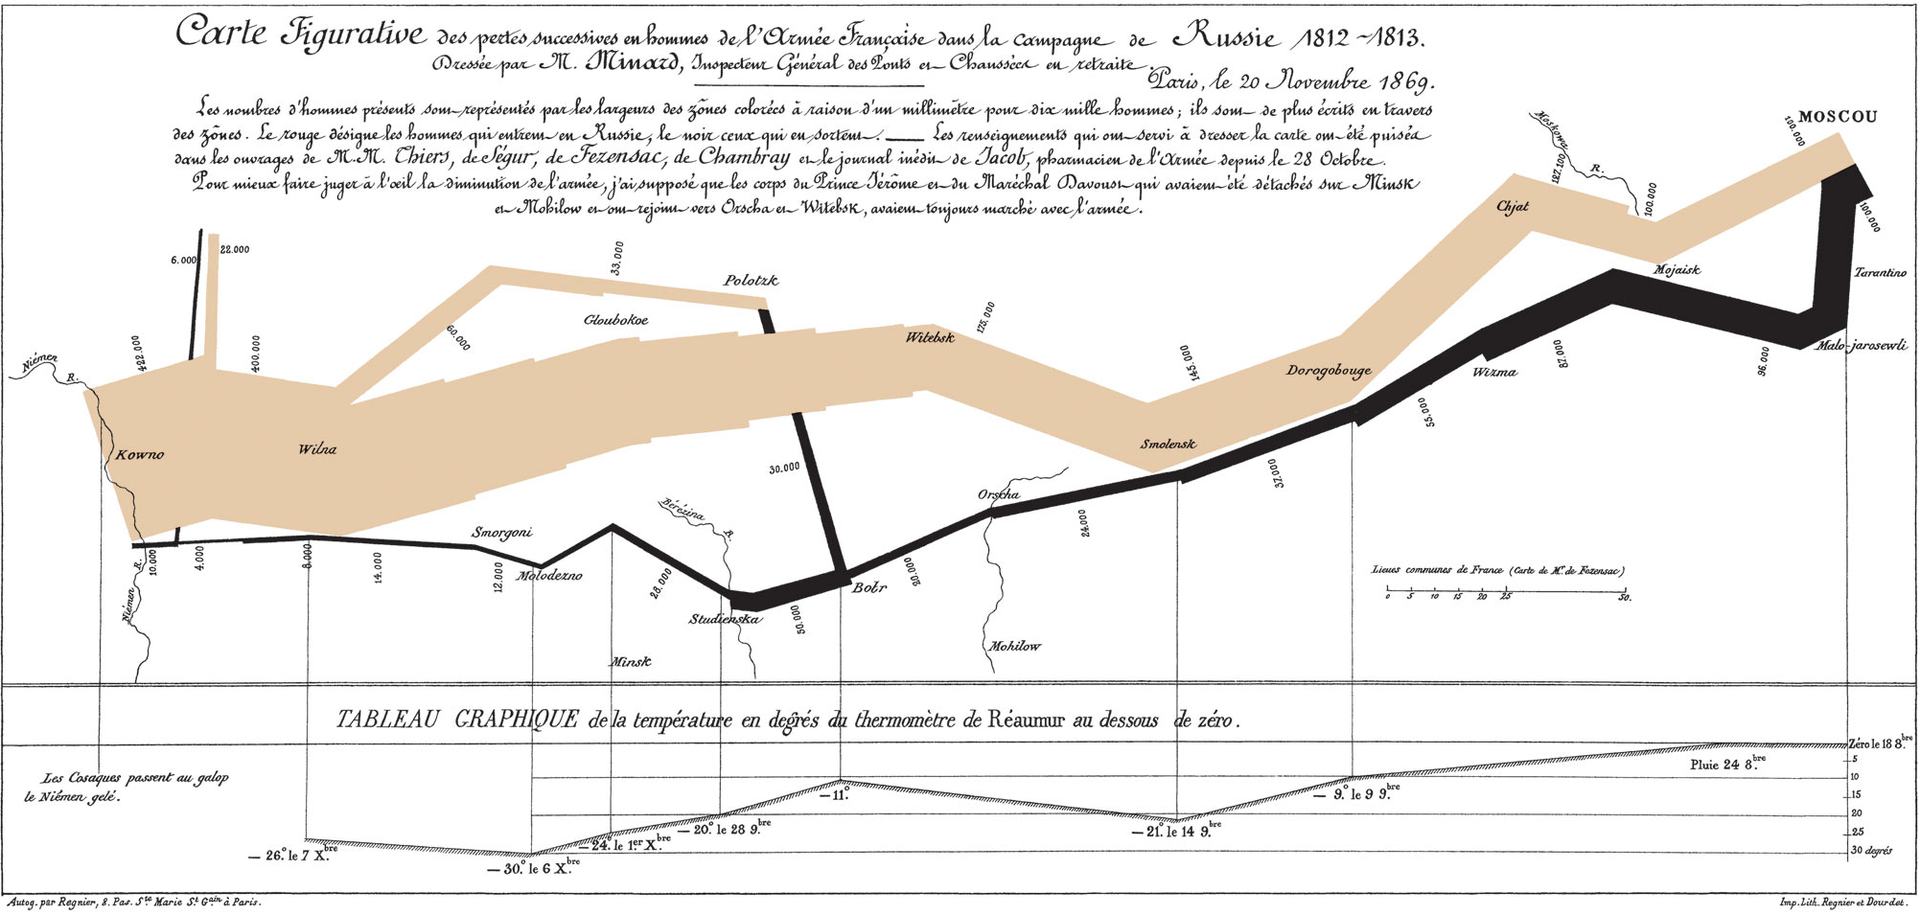
The Visual Display of Quantitative Information: Figurative Map of the successive losses in men of the French Army in the Russian campaign 1812-1813. Drawn by Mr. Minard, Inspector General of Bridges and Roads in retirement. Paris, 20 November 1869. The numbers of men present are represented by the widths of the colored zones in a rate of one millimeter for ten thousand men; these are also written beside the zones. Red designates men moving into Russia, black those on retreat.


